It can be overwhelming to try to navigate all the news concerning the coronavirus pandemic. If you have seen Johns Hopkins University’s heat map of coronavirus COVID-19 global cases, you may be feeling lost and confused about interpreting the actual and logarithmic data, along with the daily cases reported. The high numbers of confirmed cases and deaths may seem intimidating, but what do they really mean in the grand scheme of things?
Actual vs. Logarithmic Data
On the Johns Hopkins University graph for actual data, data is spaced out by every 20,000 cases. In other words, the chart is spaced out linearly and evenly. This is known as an arithmetic graph, where equal distances represent equal amounts. Most people are most familiar with this type of chart because of its straightforward nature.
The JHU graph for logarithmic data, however, spaces out data from 10 to 1,000 to 100,000. Instead of representing equal amounts, equal distances represent equal rates. In this case, each distance represents 10%. This makes it more useful in comparing rates of change.
Daily Rates of COVID-19 Growth
It would be easy to interpret the JHU graph for actual data as proof that the daily rates of (1) novel coronavirus growth outside of mainland China and (2) total recovered worldwide have been skyrocketing since February. Looking at this graph may be disheartening, as it seems to indicate an unstoppable daily uptick in novel coronavirus cases.
However, the logarithmic data shows us that the daily growth rates of COVID-19 outside of mainland China are actually slowing down.
Interpreting COVID-19 Maps
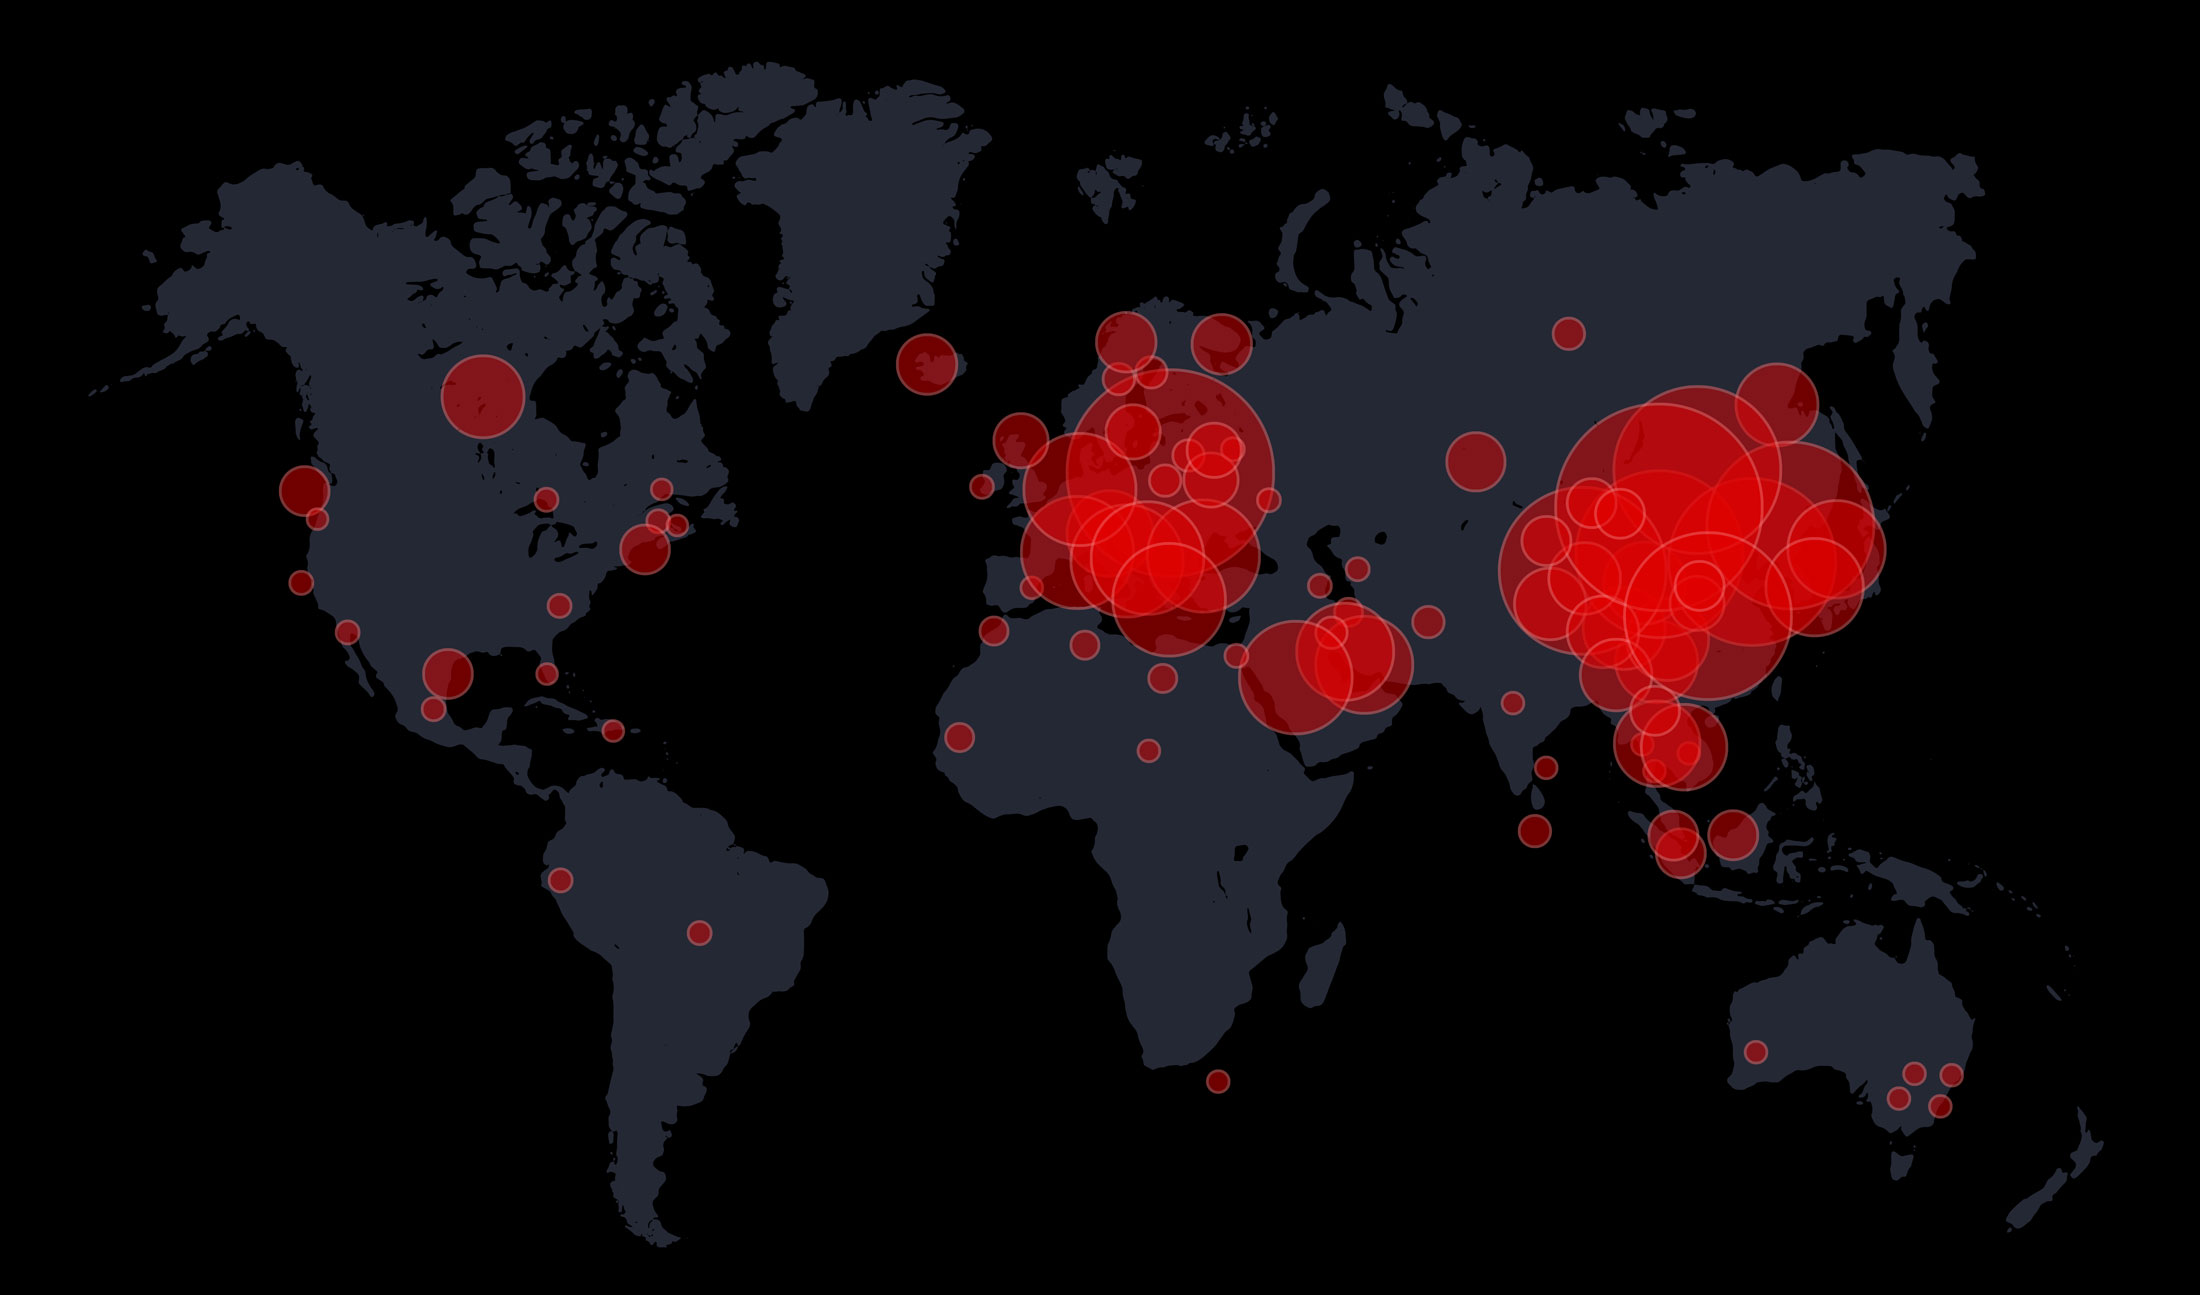
Some may also find it panic-inducing to look at JHU’s map. It is crucial to remember that the data presented does not give viewers an idea of the number of cases relative to the population. In other words, the map is using actual data. By failing to list population numbers and focusing only on COVID-19-related statistics, the map may render viewers unable to establish a baseline for comparison.
JHU’s map partially compensates for this by implementing proportional symbols in marking each region, meaning larger circles represent larger numbers of cumulative confirmed cases. Thus, viewers may be able to see which countries are more affected than others — though not proportionately so.
Significance of Current Data
The actual data suggests that cases exploded in mainland China from mid-January to early February before finally beginning to flatten out in mid-February. Additionally, the graph indicates that the total recovery rate has been on the rise. Logarithmic data confirms both of these assumptions while simultaneously showing that recovery rates may be leveling out — likely correlated with the overall slowing of new COVID-19 diagnoses.
All of this indicates that flattening the curve is still very possible, provided individuals stick to necessary precautions like social distancing.
Though the high numbers reported in COVID-19 statistics may be intimidating, they must be taken in context. Understanding how to correctly interpret the data on COVID-19 is imperative in reducing sensationalism and panic. Staying calm and keeping a clear head can help aid you in taking the preventative steps needed to keep both yourself and those around you safe.
Doctor Genius, located at 2 S Pointe Dr #200, Lake Forest, CA 92630, provides a range of services for practice success. We seek to meet our clients’ needs by providing a variety of marketing, SEO, practice optimization tools, and coaching to transform the healthcare experience. Though we work to provide the most accurate information, the content found on this website is solely intended for entertainment purposes. Therefore, we cannot guarantee that the information provided is entirely correct. You may not use the information on this site to cure, prevent, or diagnose a perceived medical issue. If you have healthcare-related needs, please speak directly to a healthcare professional. Never self-perform medical treatments discussed on this website. All images displayed are also for entertainment purposes only, and personal experiences may differ. Please note that the business tactics mentioned on this site might not be applicable to your industry or practice.